
Problem Solving and Design
What is a computer system?
A COMPUTER SYSTEM is made up of software, data, hardware, communications and people; each computer system can be divided up into a set of sub-systems. Each subsystem can be further divided into sub-systems and so on until each sub-system just performs a single action.
Top-down design
TOP-DOWN DESIGN is the breaking down of a computer system into a set of subsystems, then breaking each sub-system down into a set of smaller sub-systems, until each sub-system just performs a single action
Structure diagrams
The STRUCTURE DIAGRAM shows the design of a computer system in a hierarchical way, with each level giving a more detailed breakdown of the system into sub-systems.
Flowcharts
A FLOWCHART shows diagrammatically the steps required for a task (sub-system) and the order that they are to be performed. These steps together with the order are called an ALGORITHM
Pseudocode
PSEUDOCODE is a simple method of showing an algorithm, using English-like words and mathematical operators that are set out to look like a program
Library routines
A LIBRARY ROUTINE is a set of programming instructions for a given task that is already available for use
Sub-routines
A SUB-ROUTINE is a set of programming instructions for a given task that forms a subsystem, not the whole system
Algorithms
An ALGORITHM sets out the steps to complete a given task. This is usually shown as a flowchart or pseudocode
Validation
Validation is the automated checking by a program that data is reasonable before it is accepted into a computer system
There are many different types of validation checks including:
• range checks
• length checks
• type checks
• character checks
• format checks
• presence checks
• check digits.
Verification
Verification is checking that data has been accurately copied onto the computer or transferred from one part of a computer system to another
Verification methods include:
• double entry
• screen/visual check
• parity check
• checksum.
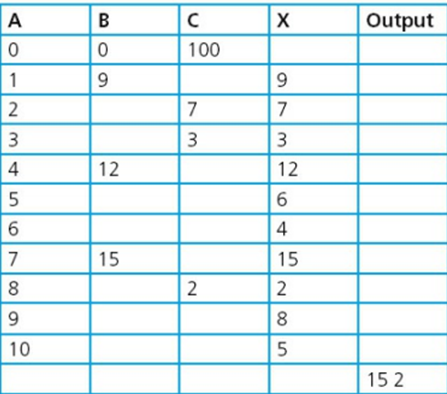
Trace tables
Trace tables are used to allow programmers to trace the value of variables as each line of code is executed. The values of the variables are displayed in a table and assist the programmer in identifying any potential errors
Test data is then used to dry run the flowchart and record the results on the trace table
Test data: 9, 7, 3, 12, 6, 4, 15, 2, 8, 5
Stages in producing an algorithm
1 Make sure that the problem is clearly specified.
2 Break the problem down into sub-problems; if it is complex, you may want to consider writing an algorithm for each sub-problem. Most problems, even the simplest ones can be divided into:
• set up
• input
• processing
• output of results.
3 Decide on how any data is to be obtained and stored, what is going to happen to the data and how any results are going to be displayed.
4 Decide on how you are going to construct your algorithm, using a flowchart or pseudocode.
5 Construct your algorithm, making sure that it can be easily read and understood by someone else. This involves setting it out clearly and using meaningful names for any data stores. The algorithms that you have looked at so far in this chapter were not designed with readability in mind because you needed to work out what the problem being solved was.
6 Use several sets of test data (normal, abnormal and boundary) and trace tables to find any errors.
7 If any errors are found, repeat the process until you think that your algorithm works perfectly