
Macroeconomy
Aggregate Demand
○ Aggregate demand is the total demand of an economy’s goods and services at a given price per period
time.
○ Aggregate demand is split to four components: Consumption (C)
Investments (I)
Government spending (G)
Net export (X-M)
○ Aggregate demand = C + I + G + (X – M)
○ Price is inversely proportional to aggregate demand due to
→ Wealth effect: As price decreases, the purchasing power of consumers increase, as people get
richer. Therefore, they are more likely to spend more money on goods and services. This increase
consumption (C)
→ Trade effect: As price decreases (weaker exchange rate), exports will become more
cheaper / competitive and imports become more expensive / less competitive. Therefore demand
and revenue generated from export increases and demand and revenue generated from imports
decreases. This increases net export (X-M)
REMEMBER ME: WIDEC / SPICED
WIDEC = W → Weak exchange rate
I → Imports
D → Dear / Expensive
E → Exports
C → Cheaper
SPICED = S → Strong exchange rate
P → Pound (UK CURRENCY)
I → Imports
C → Cheaper
E → Exports
D → Dear / Expensive
→ Interest effect: As price decreases (weaker exchange rate), interest rates are usually kept lower in
economy as central banks will adopt interest rate policies to meet an inflation
target, thus they will lower increase rates, and this increases consumption (C),
Investment (I) and lower exchange rate value which increase the value of net export
(X – M)
REMEMBER ME: Interest rates are directly proportional to exchange rate and inversely proportional to
money supply, Therefore IR ↑ then ER ↑ and MS ↓
IR ↓ then ER ↓ and MS ↑
○ Aggregate demand shifts because of C, I, G, (X – M)
Aggregate Supply
○ Aggregate supply is the total output that producers are willing and able to supply at a given price in a
given time period
○ Split into three: Short run aggregate supply (SRAS)
Long Run aggregate supply (LRAS)
Short run aggregate supply
○ Short run aggregate supply is aggregate supply in the short run where not enough time is given to the
price of the factors of production to change.
○ SRAS will shift when there is a change in the cost of production for e.g.:
→ Increases in wages
→ Increase in price of raw materials, oil, etc.
→ Indirect taxes
→ Changes on the import prices caused by changes in exchange rate (SPICED / WIDEC)
Long run aggregate supply
○ Long run aggregate supply is aggregate supply in the long run where enough time is given to the price
of the factors of production to change
○ LRAS will shift when there is a change in the quality and quantity of factors of production and a change
in productive efficiency for e.g.:
→ Labor productivity
→ Increase in quantity of labor
→ Investment on capital
→ Infrastructure (better roads, factories, etc.)
→ Competition as firms keep costs low, therefore productive efficiency
→ New resource discoveries
○ Long run aggregate supply is further split into two parts because of Keynesian’s aggregate supply curve.
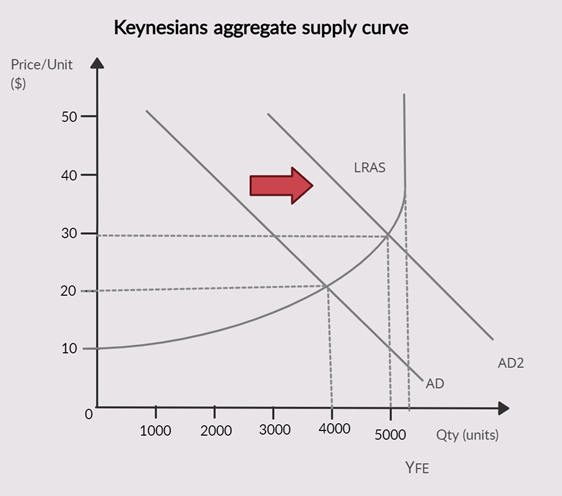
Keynesian’s thoughts Summary
○ Keynesian agrees that the LRAS curve comes to a point where production does not increase at YFE
(That is the maximum use of all factors of production at SUSTAINABLE levels)
○ Keynesian believes that the Long run aggregate supply is horizontal in the graph because of excess
spare capacity found during recessions (this is unemployed factors of production in the economy). This
can be horizontal as output can increase without any inflationary pressure. For e.g. Employment will
be cheap in an economy where supply of labor is very high
○ The closer quantity demanded is with YFE the more pressure is being exerted on the factors of
production. This can increase the cost of production for firms if out of control
○ Keynesian came up with a theory, where in order to increase the low output. Governments had to
intervene and increase aggregate demand.
→ If P1 is 20, the output is 4000 units which is far from YFE
→ Aggregate demand must shift to the right to get output closer to YFE
○ This theory became popular during the Great Depression when politicians were waiting for wages to
be variable so economy can naturally selfheal. Keynesian hypothesized that “If we keep waiting, we
will all be dead! “
○ It is Important to know that Keynesian’s aggregate supply curve will shift when there is a change in the
quality and quantity of factors of production and a change in productive efficiency (Same for standard
long run aggregate supply curve)
Macroeconomic equilibrium
○ Macroeconomic equilibrium is the price level and output where the aggregate demand and aggregate
supply intersects
Short run macroeconomic equilibrium
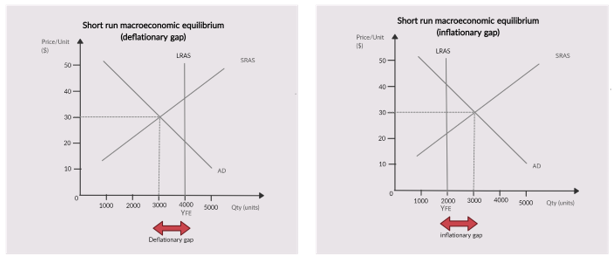
○ When YFE is greater than the output, then there is a deflationary gap
○ When YFE is lower than the output, then there is an inflationary gap
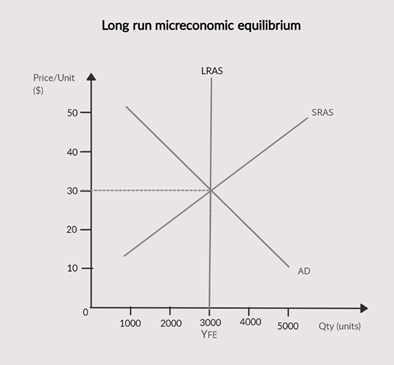
Long run microeconomic equilibrium
Inflation
○ Inflation is the rise in the price rate of goods and services which cause a fall in the purchasing power of
a currency in an economy.
○ Creeping inflation is a low rate of inflation
○ Hyperinflation is a very high rate of inflation
Inflation examples
○ Rising inflation: This type of inflation is when the rate of inflation increases yearly
○ Disinflation: This type of inflation is when the rate of inflation decreases yearly
○ Deflation: This type of inflation is when the rate of inflation is negative, therefore a decrease in the
price rate of goods and services which cause a rise in the purchasing power of a currency in an
economy
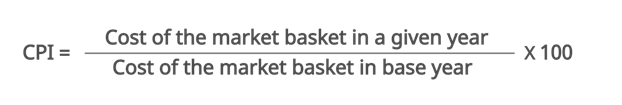
Consumer price index (CPI) JUST UNDERSTAND THIS
○ Inflation can be measured by consumer price index (CPI). This is an index that shows the average
change in price of a represented goods and services in a basket that is consumed/purchased by an
average household
○ This can be calculated by
→ Producing a survey of family expenditure in the market of goods and services.
→ The most popular goods and services are selected from the survey and is then a representative of
the basket of products purchased by an average household
→ Prices of goods and services are weighted based on the percentage of the incomes spent. For e.g.
10% of income for foods items
→ Changes in the prices of goods and services in the markets are recorded and are multiplied by the
weightage. For e.g. food prices have gone up 10%, therefore the new weightage based on the
percentage of income for food items is now 11%
Consumer price index (CPI) in application
○ A base year is selected
○ Weighted basket prices are then converted to index numbers.
→ This can be done by the formula:
○ To find the annual rate inflation rate → This can be done by the formula:

→ For e.g. → Base year is 1000
→ Prices have risen from 1050 in year 2 to 1100 in year 3
→ Difference between 1050 and 1100 is 50
→ Therefore annual inflation rate is 5% for year 3
BUT
○ A major weakness of the CPI is that it is calculated yearly, therefore it may not be accurate as
consumer’s purchasing habits are changing regularly
○ Not everyone will buy all the goods and services from the basket of goods and services. For e.g.
Purchasing patterns between rich income households and poor income households may differ
○ Certain goods have a lot of price fluctuation, so an accurate value is very hard to find (prices of food,
energy, oil etc.)
→ A core CPI can be used, where food, energy and other goods that have a lot of price fluctuations
are not calculated, therefore we can find a general inflation rate of goods and services
○ CPI does not consider housing costs like rent, mortgage, etc.
→ A CPIH can be used, where housing costs are also considered and are calculated, to find a more
accurate inflation rate of goods and services
Understand and learn
Money value is the price at which a product is operating at a current time. For e.g. A chocolate costs $5
Real value is the value that is adjusted for inflation. For e.g. Prices of chocolate has fallen by 2%, however inflation is increased by 5%. Therefore there is still a rise in the price of chocolate
Demand pull inflation.
○ A situation where aggregate demand shifts to the right. In other words, demand is being pulled
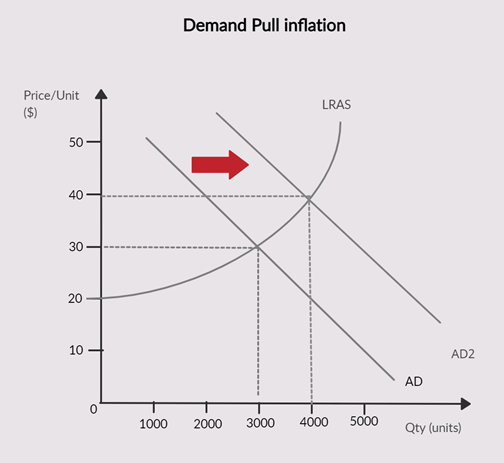
○ When aggregate demand shifts to the right, it exerts more pressure on the factors of production.
○ Factors of productions such as land, labor, enterprise, land become more expensive and as a result
increase the cost of production
○ Firms may carry the burden to the consumers via higher pricings, thus increasing price.
Why aggregate demand can shift to the right
NOTE: Aggregate demand = C + I + G + (X – M)
○ ↓ interest rates THEN (↑C, ↑I, ↑ (X-M))
○ ↓ Tax (↑C, ↑I)
○ ↑ Government spending
○ Weak exchange rate i.e. WIDEC ↑ (X- M)
○ Consumer / Producer confidence (↑C, ↑I)
Cost push inflation
○ A situation where short run aggregate demand shifts to the left. In other words, supply is being
Pushed
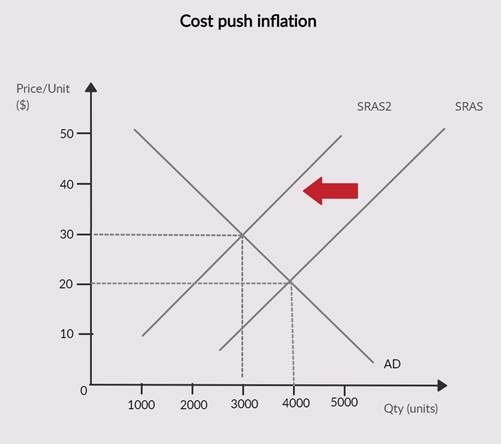
○ SRAS shifts to the left when there is an increase in the cost of production.
○ Firms may carry the burden to the consumers via higher pricings, thus increasing price.
Why SRAS shifts to the left
○ ↑ Raw material prices
○ ↑Wages
○ ↑Taxes
○ ↑Price of imported raw materials (WIDEC)
Monetarists are economists that consider inflation is caused by excessive growth in money supply
Costs and benefits of inflation
Costs of high inflation levels
○ Reduction in purchasing power of consumers, as money loses value.
○ Menu costs that occur from reprinting price lists / menu / catalogues
○ Shoe leather costs arise from transportation of money
○ Fiscal drag in the economy. It is when wages rise, and a higher proportion of income is taxed
○ Reduced international competitiveness as exports generate lower output and imports generate a
higher output. Therefore net export decreases (X – M) and aggregate demand decreases
○ Anticipation of inflation can cause wage spirals and consumer spirals
○ Uncertainty due to inflation, therefore it holds back investment (I) and consumption (C) therefore
decreasing aggregate demand
○ Lowers the value of savings
Benefits of low inflation levels
○ Workers benefit to demand more wages
○ Increase production to produce more for profit
○ Decrease in unemployment during recession as there is a lower real cost of labor
○ Reduce the burden of debt as the value of money falls. Therefore it becomes easier for the borrows to
pay back to the lenders
Identify if inflation is bad or good in an economy
○ Demand pull inflation is healthier for the economy compared to cost push inflation (You can scroll up
and see cost push inflation decreases output)
○ Short term inflation is not bad, but long-term/persistent inflation and anticipated inflation is
disastrous
○ If inflation is anticipated then there may be many problems because of wage and consumption spirals
that occur because of anticipated inflation
○ Rate of inflation
How to prevent demand pull inflation
○ Contractionary fiscal / monetary policies
→ “↓ Government spending , money supply”
→ “↑ Taxes, Interest rates, Exchange rate”
○ However as a result, there is a fall in growth and unemployment rises
How to prevent cost push inflation
○ Government may restrict wages ( Adding maximum wages)
○ However restricting wages may demotivate workers
○ ↓ Indirect taxes on raw materials to reduce the cost of production for firms
○ Aiding firms by providing subsidies
○ However subsidies may promote inefficiency because of over reliance on subsidies
○ Supply side policies to increase aggregate supply ( long run )
Deflation is the sustained fall in price rate of goods and services, while Disinflation is the fall in inflation rate.
Deflation
○ Deflation is when inflation rate is a negative value.
○ They are two types of deflation
→ Demand side deflation
→ Supply side deflation
Demand side deflation
○ This type of deflation is bad; it occurs when aggregate demand shifts to the left.
○ Demand side deflation comes with lower growth (Output decreases)
○ Deflation is usually long term and anticipated (Economists suggest)
Supply side deflation
○ When SRAS shifts to the right
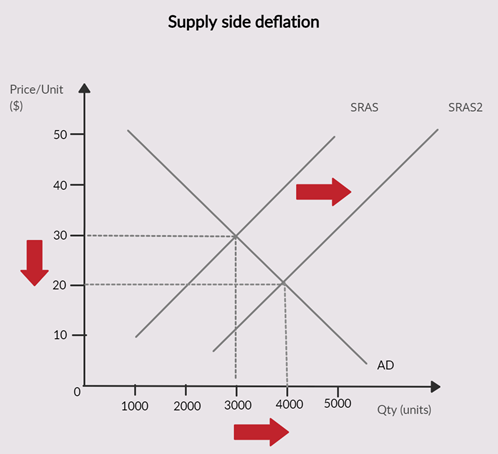
○ Comes with higher growth (Output increases)
○ Deflation is usually short term and unanticipated (Economists suggest)
Anticipated deflation is SCARY!
Deflation spiral
○ Delayed spending because consumers wait till prices reach the bottom, due to this firms will further
decrease their prices to increase demand
○ Lower aggregate demand, which leads to higher unemployment and lower growth as a result
○ Deflation promotes savings and less borrowing, therefore consumption (C) and investment (I)
investment will fall
○ Becomes harder for borrowers to pay back debt to lenders
Short term deflation benefits
○ Purchasing power of consumers increase
○ Firms will benefit from lower cost of production
Balance of payments
○ The balance of payments is a record of all transactions of a country over a year, this includes money
entering and leaving the country
○ Split into three parts
→ Current account
→ Financial account
→ Capital account
Current account
○ Current account is split into four parts
→ Trade in goods
→ Trade in services
→ Income
→Transfers
Current account deficit
○ The current account deficit is when the imports are greater than the exports.
○ Can be caused when : Demand side → Strong domestic growth (Increase demand for imports)
→ Recession abroad (Decrease price of imports)
→ Strong exchange rate (SPICED)
Supply side → Low investment (Domestic goods are not competitive)
→ Low productivity (Domestic goods are not competitive)
→ High relative inflation (SPICED)
→ High labor costs (SPICED)
→ Poor quality (Domestic goods are not competitive)
→ Depletion of resources
Consequences of current account deficit
○ Lower aggregate demand as net export is negative (X – M). This will lead to lower growth and higher
unemployment.
○ Value of savings decrease; due to uncertainty it can causes panic. People will move money away from
the country to avoid value of savings to decrease. This leads to a currency crisis as the money supply is
increasing. In turn then more people will move their money away from the country. It becomes a cycle
causing economic crisis
○ Since imports are higher than exports, it may lead to higher money supply which causes exchange rate
to fall (WIDEC) . This as a result may fix current account deficit but may lead to stagflation. This point
contradicts the above, however this is also a possibility.
Current account surplus
○ The current account surplus is when the exports are greater than the imports
○ Can be caused when : Demand side → Weak domestic growth (Decrease demand for imports)
→ High growth abroad (Increase demand for your exports)
→ Weak exchange rate (WIDEC)
Supply side → High investment (Domestic goods are more competitive)
→ High productivity (Domestic goods are more competitive)
→ Low relative inflation (WIDEC)
→ Low labor costs (WIDEC)
→ High quality (Domestic goods more competitive)
→ Discovery of resources
Consequences of Current account surplus
○ Higher aggregate demand as net export is positive (X-M). This may lead to higher growth and lower
unemployment, however, may lead to inflation (demand pull inflation)
○ Can cause a current account deficit as there may be an appreciation of exchange rate as people
demand the currency leading to a low money supply ( Exports are greater than imports)
○ Can harm international relationships between country (Like in China). CA surplus brings pressure to
other countries with CA deficit; therefore they retaliate by protectionism.
○ Sign of unbalanced economy as maybe all goods are being exported and not enough goods are
maintained for domestic consumers to purchase the product (Like in China)
NOTE
Current account is a tricky part of the chapter to learn because of all these extra points, however you can score 100% by mentioning all the points here
Financial account
○ Portfolio investments like bonds, shares(financial assets)
○ Foreign direct investments
○ Reserves through gold or currency
Capital account
Debt forgiveness
○ Inheritance taxes / death duties
○ Sales of tangible, like Currency or property, and intangible assets, like trademarks.
○ Money by migrants
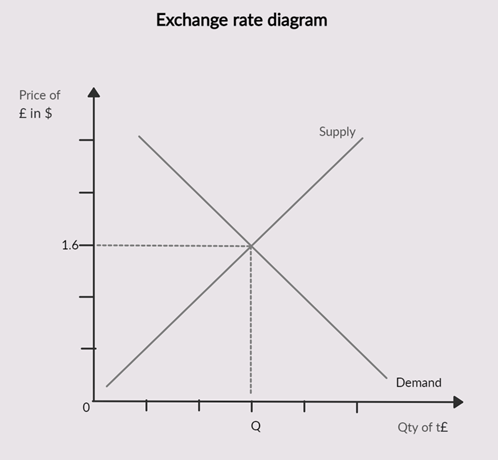
Exchange rate
○ Exchange rate is the price of one currency compared to the price of another currency, for example
£1.00 : 1.60
Exchange rate and purchasing power parity (PPP)
○ Have a look at this example : Example 1
UK Basket Nominal exchange rate US Basket
£100 £1.00 : $1.60 $160
○ In example 1, the UK basket of goods and services will buy equal to the US basket of goods and services when the currency is converted.
Example 2
UK Basket Nominal exchange rate US Basket
£100 £1.00 : $1.60 $170↑
○ In example one, the US basket of goods and services have increased because of inflation,
due to this : → £ is undervalued in $
→ $ is overvalued in £
○ As a result, UK basket of goods and services, are now cheaper.
Therefore : → The demand of the £↑ which appreciates the price of the £
→ The supply of the $↑ which depreciates the price of the $
○ This will repeat until exchange rate of £1.00 : $1.70 is reached.
Nominal exchange rate
○ Nominal exchange rate is the price of one currency in another currency
Real exchange rate
○ Real exchange rate is the price of one currency in another currency in terms of real purchasing power
○ £1.00 : $1.70 is the real exchange rate
Floating exchange rate
○ Floating exchange rate is an exchange rate that is determined by the market forces of demand and
supply. For e.g.: In a current account deficit.
→ The imports are greater than the exports, due to this money supply will increase
→ Money supply is greater, therefore it will lead to depreciation of the currency
→ This depreciation will lead to (WIDEC) imports being more expensive and exports
being cheaper
→ Therefore correcting a current account deficit
Fixed exchange rate
○ Fixed exchange rate is an exchange rate that is set and maintained by the government or central bank.
They use currency reserves to do this.
→ For e.g.: IF the fixed exchange rate is £1.00 : $1.60 and for some reason it is now £1.00 : $1.70.
→ This means that the £ has appreciated in value and to fix this, we must depreciate the £.
→ We can depreciate the £ by increasing the money supply
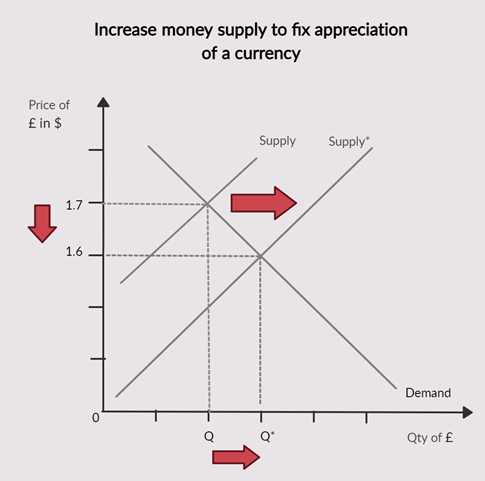
→ In this way we have depreciated the price of the £ back to the fixed exchange rate. While doing
so, we were able to increase quantity of the £ to Q*
→ For e.g.: IF the fixed exchange rate is £1.00 : $1.60 and for some reason it is now £1.00 : $1.50
→ This means that the £ has depreciated in value and to fix this, THIS TIME we increase demand.
→ We can increase demand by using foreign currency reserves to buy more £
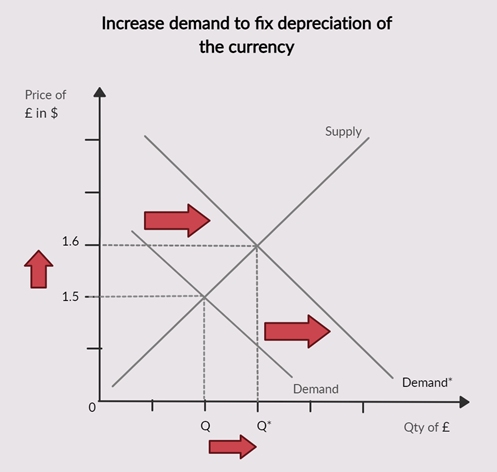
→ In this way we have appreciated the price of the £ back to the fixed exchange rate. While doing
so, we were able to increase quantity of the £ to Q*
○ For fixed exchange rate, it is important to note that interest rates are used to manipulate money
supply. This alone carries a whole lot of problems
○ It is also important to note that interest rates are inversely proportional to the money supply even in
monetary policy ( Understand this relationship )
→ Interest rates ↑
→ Money supply ↓
→ Exchange rate ↑
Floating or fixed exchange rate
Floating exchange rate
○ In a floating exchange rate, there is no need for large reserves of currency.
○ It is not involved with interest rates, which may worsen the economy
○ Can correct current account deficit or current account surplus
However
○ Very volatile, no guarantee that exchange rate will be balanced
○ May not correct current account surplus or deficit as there are many other factors that may affect it
○ Risk with floating exchange rate when dealing with inflation
Fixed exchange rate
○ Exchange rate is held constant; therefore it makes it easier to trade, invest, etc.
○ Exchange rate becomes very flexible (Politically cannot occur, as other countries may revolt but none
the less can occur)
However
○ tampering with Interest rates, which may worsen the economy
○ Requirements of a large amount of currency reserves, which can be costly
Managed float exchange rate
○ Managed float exchange rate is an exchange rate that combines the features of floating and fixed
exchange rate
○ It is set by market forces of demand and supply but can also be intervened by the government or
central bank
Appreciation of exchange rate
SPICED
○ Appreciation of exchange rate means SPICED, therefore SPICED = S → Strong exchange rate
P → Pound (UK CURRENCY)
I → Imports
C → Cheaper
E → Exports
D → Dear / Expensive
Demand Side (exports)
○ When exchange rate appreciates in price, Exports are expensive.
○ Due to this AD to shift to the left
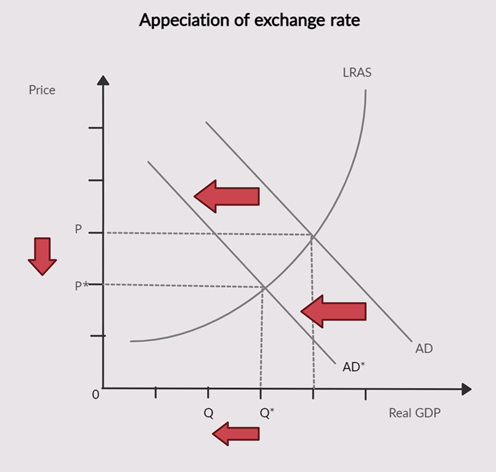
○ When AD shift to the left, it causes a decrease in the price levels and a fall in the real GDP
○ This will lead to lower growth and higher unemployment, however there will be lower inflation rates
in the economy
Supply Side (imports)
○ When exchange rate appreciates in price, imports are cheaper.
○ Due to this SRAS to shift to the right
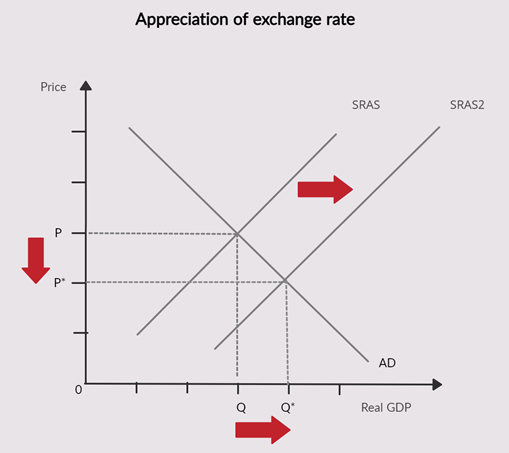
○ When SRAS shift to the right, it causes a decrease in the price levels and a rise in the real GDP
○ This will raise standard of living because of the fall in price
○ An appreciation of the exchange rate will also grant gains for the domestic firm, via lower import
prices of raw materials
Depreciation of exchange rate
WIDEC
○ WIDEC = W → Weak exchange rate
I → Imports
D → Dear / Expensive
E → Exports
C → Cheaper
Demand Side (exports)
○ When exchange rate depreciates in price, Exports are cheaper, hence more competitive
○ Due to this AD to shift to the right
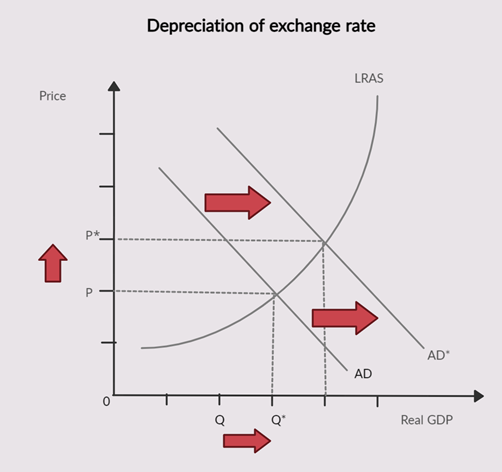
○ When AD shift to the right, it causes a increase in the price levels and a rise in the real GDP
○ This will lead to higher growth and lower unemployment, however there will be higher inflation rates
in the economy (higher inflationary pressure via cost push and demand-pull inflation)
Supply Side (imports)
○ When exchange rate depreciates in price, imports are expensive.
○ Due to this SRAS to shift to the left
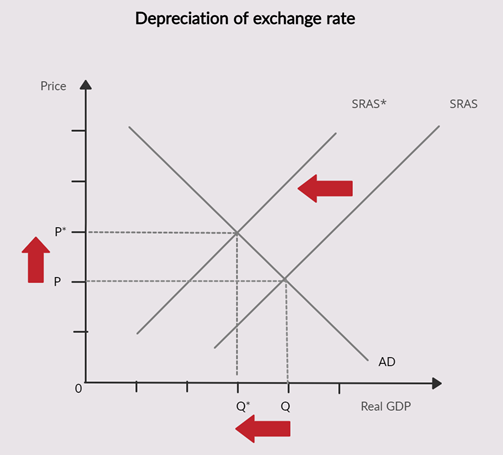
○ When SRAS shift to the left, it causes an increase in the price levels and a fall in the real GDP
○ Can fix a current account deficit, however risk of cost push inflation
Marshall Learner condition
○ The Marshall – learner condition states that a currency depreciation will only correct the CA deficit if
the PEDX + PEDM < 1 ( sum of PED of export and import is elastic )
PED and total revenue / Expenditure
EOIS
○ To learn the relationship between price and total revenue, remember EOIS
○ Remember EOIS = E → Elastic
O → Opposite
I → Inelastic
S → Similar
○ For example:
→ If product is elastic (opposite)
↑ P, Therefore ↓ Total revenue
↓ P, Therefore ↑ Total revenue
→ If product is inelastic (Similar)
↑ P, Therefore ↑ Total revenue
↓ P, Therefore ↓ Total revenue
○ Just remember that total revenue is for exports and expenditure is for imports
→ PEDX inelastic = P↑, therefore TR↑
→ PEDM inelastic = P↑, therefore Expenditure ↑ (total revenue for imports would ↓)
→ PEDX elastic = P↑, therefore TR↓
→ PEDM elastic = P↑, therefore Expenditure ↓ (total revenue for imports would ↑)
○ expenditure will have an opposite relationship to total revenue
○ Most A/AS level questions will consist of total revenue, very rarely will questions come for
expenditure. However it is good to know this just in case. This will help in MCQ’s
○ You may run into questions that ask you which situation is better
→ PED(X-M) inelastic
P↑ or P↓
○ If you remember inelastic is similar, therefore an increase in price will increase total revenue and a
decrease in price will decrease the total revenue.
○ The situation that would be better for the economy is one where total revenue would rise.
○ Therefore we can conclude that an increase in price would be a better situation as total revenue
would rise as a result
→ PED(X-M) elastic
P↑ or P↓
○ If you remember elastic is opposite, therefore an increase in price will decrease total revenue and a
decrease in price will increase the total revenue.
○ The situation that would be better for the economy is one where total revenue would rise.
○ Therefore we can conclude that an decrease in price would be a better situation as total revenue
would rise as a result
○ PEDX + PEDM = PED(X-M)
J Curve
○ A fall in the exchange rate reduces CA deficit to a CA surplus.
○ J curve is when a fall in the exchange rate leads to an increase in CA deficit before reducing to a CA
surplus.
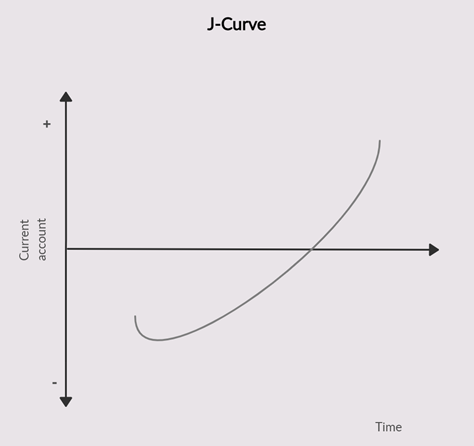
○ This occurs because the demand of exports and imports are relatively inelastic in the short run
because it takes time to recognize a change in price
Terms of Trade (TOT)
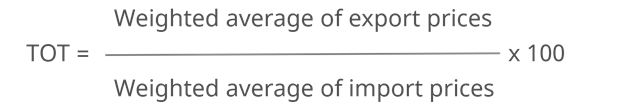
○ The TOT shows a country the number of exports that need to be sold to purchase a given level
of imports
○ The value is an index
○ The higher the value, the better the country at which it stands as more imports can be purchased with
a lower number of exports
○ The lower the value, the worse the country at which it stands as less imports can be purchased with
the same level of exports
Changes on TOT in short run
○ Demand/supply of exports/imports
○ Relative inflation rates
○ Changes in exchange rates
Changes on TOT in long run
○ Incomes
○ Productivity
○ Technology
Evaluation on TOT
I did run into a question which told me to evaluate TOT
○ TOT only calculates prices.
○ TOT does not consider the quantity, elasticity, etc.
○ TOT depends on international competition.
○ Total revenue needs to be calculated to know if increasing the value of TOT is a good thing or not
Absolute advantage
○ Absolute advantages occurs when a country can produce a product using fewer factors of production
than another country
Comparative advantage
○ Comparative advantage occurs when a country can produce a product with a lower opportunity cost
compared to another country, hence should see to specialize in producing that specific product and
trade with other countries.
The example below shows clear understanding of the benefits of understanding comparative and absolute advantages. It also shows the before and after specialization
Example was taken from the AS and A level Economics textbook.
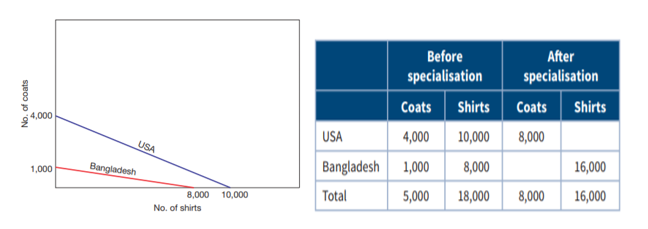
Analysis of comparative advantage and absolute advantage
○ USA had absolute advantage in producing both coats and shirts because it produced the products with
few factors of production compared to Bangladesh
○ Bangladesh had a comparative advantage in producing shirts because it produced shirts at a lower
opportunity cost compared to USA
○ After specializing in their own respective products. Both USA and Bangladesh were able to maximize
their total production of both coats and shirts
Free Trade
○ Free trade is trading between countries without any trade barriers like tariffs, quotas, embargos, etc.
Benefits of a free trade
○ Incentive to follow the law of comparative advantage, therefore an increase in efficiency/output and
increase in allocative efficiency
○ A wider access to goods and services that are not produced domestically, therefore a wider variety of
consumer choice
○ Consumer benefits from lower prices
○ Huge competition therefore more efficient market
○ Benefits from economies of scale
○ Economic growth
A few key terms to understand
Economic integration
○ Economic integration is a process where countries aim to lower trade barriers and to harmonies
monetary and fiscal policies.
Trading bloc
○ Trading bloc is a group of countries who agree to increase trade barriers between themselves
Bilateral/Multilateral trade agreement
○ Bilateral/Multilateral trade agreement is an agreement to lower tariff and quotas between 2 or
multiple countries
Trade agreements vary in different levels
○ Just understand the different levels of trade agreement
○ Questions based on this are very uncommon but happen regardless
→ Preferential trading area (PTA)
→ Free trade area (FTA)
→ Custom unions
→ Common market
→ Economic and monetary union
→ Full economic integration
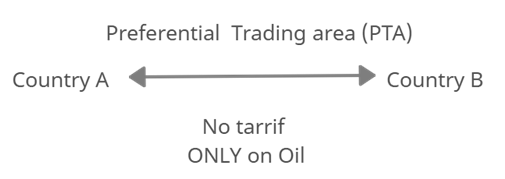
Preferential Trading area (PTA)
○ PTA is where countries join to reduce tariffs/quotas but only on specific goods
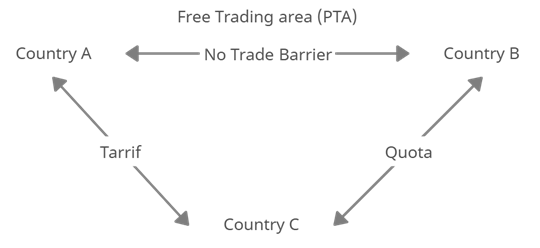
Free Trading area (FTA)
○ FTA is where countries eliminate all trade barriers amongst themselves, however they can trade however they want outside of FTA
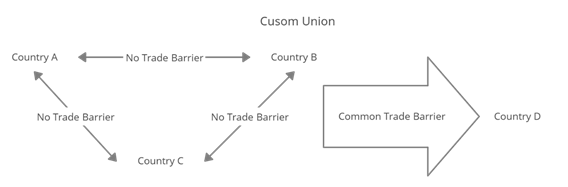
Custom union
○ Custom union is where countries remove trade barriers amongst themselves, however a common
trade barrier is imposed on countries outside of the custom union
Common market
○ Common market is like custom union but with free movement of labor, capital, etc.
Economic and monetary union
○ Economic and monetary union adopts everything in common market and follows under the same
currency, central bank, monetary policy
Full economic integration
○ Full economic integration completely harmonizes all policies (fiscal/monetary). It is ruled by a singular
government body. E.g. England, Whales, Scotland
Trade Creation
○ Trade Creation is creation of trade. It is a theory when a non-member country joins a custom union
and becomes a member of a custom union, thus removal of trade barriers between the countries
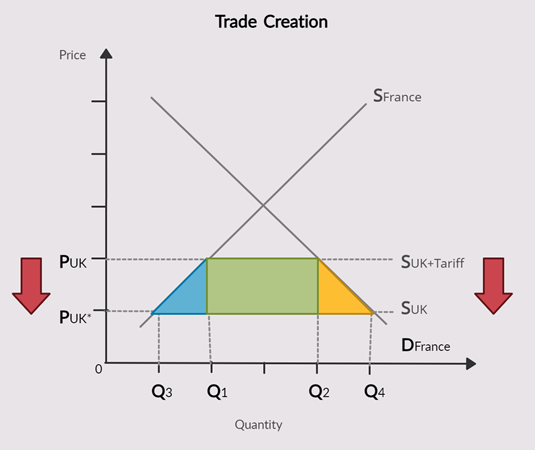
○ This example shows France joining a custom union and becomes a member of a custom union with
UK.
○ Normally, Price is at PUK and this is the import supplied with tariffs.
○ Because of joining a custom union, France is forced to remove all trade barriers, hence price falls to
PUK* where the import is supplied without tariffs.
○ As a result, Quantity supplied increases from Q1 to Q3 and quantity demanded increases to Q2 to Q4
○ The blue region is gain in world efficiency
○ The yellow region is Consumer surplus gain
○ The green region is dead weight loss of government revenue from tariffs.
Trade diversion
○ Trade diversion is the diversion of trade. It is a theory when a non-member country joins a custom
union and becomes a member of a custom union.
○ In Trade diversion, we look at the trade relationship with OTHER countries that are outside of the
custom union
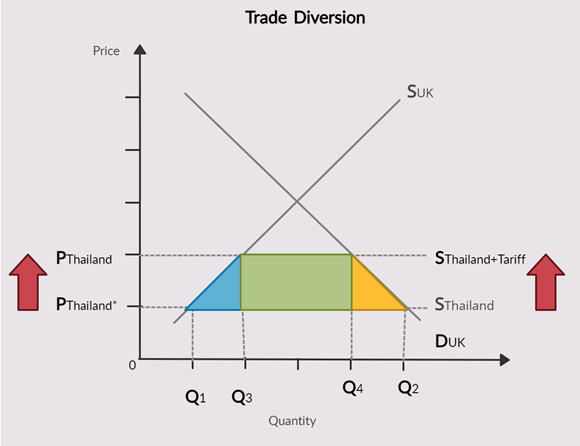
○ This example shows UK joining a custom union and becomes a member of a custom union with EU.
○ Normally, Price is at PThailand and this is the import supplied without tariffs.
○ Because of joining a custom union, UK is forced to follow a policy to implement a common trade
barrier with all imports from Thailand, hence price rises to PThailand* where the import is supplied with
tariffs.
○ As a result, Quantity supplied decreases from Q1 to Q3 and quantity demanded decreases to Q2 to Q4
○ The blue region is dead weight loss in world efficiency
○ The yellow region is dead weight loss in Consumer surplus
○ The green region is the gain of government revenue from tariffs.
Trade protectionism
○ Protects domestic infant industries by providing them time to develop against foreign industries
○ Protects against dumping / poor quality products entering the country
○ Protects domestic employment
○ Raises government revenue in the form of tariffs
○ Improves current account deficit by limiting imports entering the country (This is politically wrong and
therefore expect retaliation from other countries if done)
○ Protects against unfair lower cost abroad (When government over subsidies production to gain
international competitiveness)
Methods of trade protectionism
○ Tariffs
→ Tariffs are taxes imposed on imports coming from abroad. It is a mean of protectionism
○ Quotas
→ Quotas are a limit on imports. The limit is imposed as the quantity of imports that can enter the
country.
○ Exchange control
→Exchange control is restricting purchasing foreign currency that would normally be used to buy
Imports For example : A limit to restrict the number of Dirhams to Dollars. Consumers will not be
able to purchase freely as a result and are forced to restrict buying US imports
○ Embargos
→ Embargos is a complete ban on certain imports like drugs, weapons, etc.
○ Export subsidies
→ Export subsidies are used to provide subsidies to domestic firms to increase output and
international competitiveness via lower prices
○ Lowering exchange rate (WIDEC)
→ Lower exchange rate will cause the imports to become more expensive and exports to become
cheaper,