
Market Research
- Market research- the process of collecting, recording, and analysing data about customers, competitors, and the market
THE NEED FOR MARKET RESEARCH
- To reduce the risks associated with new product launches
- By investigating potential demand for a new product or service, the business should be able to assess with some degree of accuracy the likelihood of a new product achieving satisfactory sales
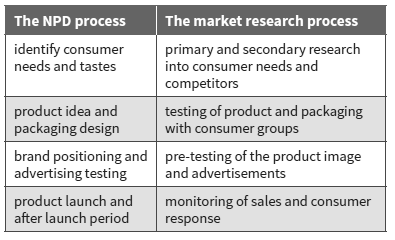
- Market research is still a key part of new product development (NPD) and most firms would aim to check market conditions before planning the launch of a new product
- To predict future demand changes
- To explain patterns in sales of existing products and market trends
- Market research is also conducted for existing products- by conducting market research, managers are able to make informed decisions on any changes that need to be made to the existing product
- To assess the most favoured designs, flavours, styles, promotions, and packages for a product
- Consumer tests of different versions of a product or of the proposed adverts to promote it will enable a business to focus on the aspects of design and performance that consumers rate most highly- these can then be incorporated into the final product
THE MARKET RESEARCH PROCESS
- Management problem identification
- A business has to identify the purpose of their research through choosing which specific problem to investigate
- Examples of some problems that might be investigated by market research-
- What size is the potential market for this business?
- Why are our sales falling?
- How can we break into the market in another country?
- How can we most effectively meet the challenge of new competitors?
- What customer groups buy our products and what groups tend not to buy them?
- By setting the problem out accurately, the rest of the market research process can then be directed accurately towards solving it
- Research objectives
- These objectives must obviously tie in with the original problem- they must be set in such a way that, when they have been achieved, they provide all of the information needed to solve the problem
- Sources of data- primary and secondary research
- Primary research- the collection of first-hand data that is directly related to a firm’s needs
- Advantages
- up-to-date and therefore more useful than most secondary data
- relevant – collected for a specific purpose – directly addresses the questions the business wants answers to
- confidential – no other business has access to this data
- Disadvantages
- costly – market research agencies can charge thousands of dollars for detailed customer surveys and other market research reports
- time-consuming – secondary data could be obtained from the internet much more quickly
- doubts over accuracy and validity – largely because of the need to use sampling and the risk that the samples used may not be fully representative of the population
- Advantages
- Secondary research- collection of data from second-hand sources
- Advantages
- often obtainable very cheaply – apart from the purchase of market intelligence reports
- identifies the nature of the market and assists with the planning of primary research
- obtainable quickly without the need to devise complicated data-gathering methods
- allows comparison of data from different sources
- Disadvantages
- may not be updated frequently and may therefore be out-of-date
- as it was originally collected for another purpose, it may not be entirely suitable or presented in the most effective way for the business using it
- data-collection methods and accuracy of these may be unknown
- might not be available for completely new product developments
- Advantages
- Primary research- the collection of first-hand data that is directly related to a firm’s needs
SOURCES OF SECONDARY DATA
- Government publications
- These include population census, social trends, economic trends, annual abstract of statistics, family expenditure survey, etc
- Local libraries and local government offices
- If the research data needed were only for a small area then only local data would be necessary, such as:
- local population census returns with details of total numbers and age and occupation distributions
- numbers of households in the area
- the proportions of the local population from different ethnic and cultural groups
- If the research data needed were only for a small area then only local data would be necessary, such as:
- Trade organisations
- Trade organisations produce regular reports on the state of the markets their members operate in
- Market intelligence reports
- These are very detailed reports on individual markets and industries produced by specialist market research agencies
- They are usually very expensive, but are usually available at local business libraries
- Examples- Mintel reports, Key Note reports, Euromonitor
- Newspaper reports and specialist publications
- Examples- The Grocer, Motor Trader, The Financial Times
- Internal company records
- If the business has been trading for some time, a great quantity of secondary data will already be available for further analysis from:
- customer sales records
- guarantee claims
- daily, weekly, and monthly sales trends
- feedback from customers on product, service, delivery, and quality
- If the business has been trading for some time, a great quantity of secondary data will already be available for further analysis from:
- The Internet
- Whenever research is conducted just from the internet, the accuracy and relevance of the source should always be checked
METHODS OF PRIMARY RESEARCH
- Primary research can be divided into quantitative or qualitative research
- Qualitative research- research into the in-depth motivations behind consumer buying behaviour or opinions
- Quantitative research- research that leads to numerical results that can be statistically analysed
- Qualitative research
- Focus groups
- A group of people who are asked about their attitude towards a product, service, advertisement, or new style of packaging
- Questions are asked and participants are encouraged to actively discuss their responses – all members of the group are free to talk with other group members
- This information is often believed to be more accurate and realistic than the responses to individual interviews or questionnaires, where respondents do not have the discussion opportunity
- Researchers are present in the focus group and they take part in the discussion as well, but only to stimulate it – not to lead the group to a particular conclusion
- Possible drawbacks:
- Timewasting as some members of the group may discuss issues not directly related to the research- the researchers present will have to keep them ‘on target’ at all times
- The data collected can be difficult to analyse and present to senior managers
- There might be the risk of researchers leading or influencing the discussion too much, leading to biased conclusions
- Focus groups
- Quantitative research
- Observation and recording
- Using this approach, market researchers observe and record how consumers behave
- They can count the number of people or cars that pass a particular location in order to assess the best site for a new business
- Researchers can also observe people in shops to see how many look at a new display or take a product from the shelves
- A simple inventory check can also be used to record sales over a period of time
- Observation and recording
- Possible drawbacks:
- Results can be distorted if people are aware of being watched and behave differently because of this
- Observation does not give researchers the opportunity to ask for explanations of behaviour – it records only what actually happens
- Test marketing
- This can take place after a decision has been made to produce a limited quantity of a new product but before a full-scale, national launch is made
- It involves promoting and selling the product in a limited geographical area and then recording consumer reactions and sales figures
- To be reasonably accurate, the region selected must reflect as closely as possible the social and consumer profiles of the rest of the country
- Consumer surveys
- These involve directly asking consumer or potential consumers for their opinions and preferences- they can be used to obtain both qualitative and quantitative research
- There are 4 important issues for market researchers to be aware of when conducting consumer surveys:
- Who to ask?
- What to ask?
- How to ask?
- How accurate is it?
WHO TO ASK- SAMPLE SIZE
- Sample- the group of people taking part in a market research survey selected to be representative of the overall target market
- In nearly all market research situations it is impossible to seek evidence from the total ‘population’, i.e. the total potential market that the firm is aiming at- this is either because that market is so extensive that contacting everyone in it would be too expensive or time-consuming or it is impossible to identify everyone in that market
- In general, the larger the sample, the more representative of the total population it is likely to be and greater confidence can be placed in the final results
WHO TO ASK- SAMPLING METHODS
- Probability sampling
- This involves the selection of a sample from a population based on the principle of random chance
- However, because the sample is selected randomly and the probability of each unit’s inclusion in the sample can be calculated, very reliable estimates can be made about both the whole target market (the ‘statistical population’) and about the chances of errors occurring
- Most common methods of probability sampling:
- Simple random sampling-
- Each member of the target population has an equal chance of being included in the sample.
- To select a random sample the following are needed:
- a list of all of the people in the target population
- sequential numbers given to each member of this population
- a list of random numbers generated by computer
- If a sample of 100 is required, then the first 100 numbers on the random number list are taken and the people who had these numbers allocated to them will form the sample
- Stratified sampling-
- This method recognises that the target population may be made up of many different groups with many different opinions- these groups are called strata or layers of the population and for a sample to be accurate it should contain members of all of these strata
- This draws a sample from a specified sub-group or segment of the population and uses random sampling to select an appropriate number from each stratum
- Quota sampling-
- When the population has been stratified and the interviewer selects an appropriate number of respondents from each stratum
- Simple random sampling-
- Non-probability sampling
- This approach to sampling cannot be used to calculate the probability of any particular sample being selected
- Non-probability sample results cannot be used to make inferences or judgements about the total population
- Most common methods of non-probability sampling:
- Convenience (opportunity) sampling
- Members of the population are chosen based on their relative ease of access
- Sampling friends, fellow workers, or shoppers in just one location are all examples of convenience sampling
- Snowball sampling
- The first respondent refers a friend who then refers another friend and so the process continues
- This is a cheap method of sampling and is often used by companies in the financial services sector, such as health- and motor-insurance companies
- It is likely to lead to a biased sample, as each respondent’s friends are likely to have a similar lifestyle and opinions
- Convenience (opportunity) sampling
WHAT TO ASK- QUESTIONNAIRE DESIGN
- Open questions- those that invite a wide-ranging or imaginative response – the results will be difficult to collate and present numerically
- Closed questions- questions to which a limited number of pre-set answers is offered
- As the design of the questionnaire will greatly influence the accuracy and usefulness of the results, it is advisable to undertake an initial pilot survey to test the quality of the questions. Other principles to follow include:
- making the objectives of the research clear so that questions can be focused on these
- writing clear and unambiguous questions
- trying to make sure that the questions follow each other in a logical sequence
- avoiding questions that seem to point to one particular answer
- using language that will be readily understood
- including some questions that will allow classification of results by gender, area lived in, occupation, etc
HOW TO ASK- SELF-COMPLETED QUESTIONNAIRE AND DIRECT INTERVIEWS
- Self-completed questionnaires are either sent through the post or filled in by the respondent themselves ‘on the spot’, for example in a shop
- Postal surveys are relatively cheap to send out, a wide geographical area can be covered and there is no chance of bias creeping in from the interviewer to distort results
- However, the response rate to both these and other forms of self-completed questionnaires is nearly always very poor, questions could easily be misunderstood, and the sample returned could be biased in favour of those respondents with the most spare time, for example retired people.
- Direct interviews are conducted by an interviewer, usually either in the street or in the respondent’s home
- Skilled interviewers will avoid bias in the way in which they ask questions, and detailed questions can be explained to the interviewee. Follow-up questions can be asked if required
- This can be an expensive method, but the interviewer will continue their work until the pre-set sample size has been reached
HOW ACCURATE IS PRIMARY RESEARCH?
- There are 3 main reasons why primary data may not be as reliable as hoped for:
- Sampling bias
- The only really accurate method of primary research is to ask the entire target population, but this is not always possible
- Results from a sample may be different from those that would have been obtained if the entire target population had been questioned- this is called sampling bias
- The less care that is taken in selecting a sample, then the greater the degree of statistical bias that will exist- therefore, no one can be 100% confident that sample results are really accurate
- Questionnaire bias
- This may occur when questions tend to lead respondents towards one particular answer- the results are not a completely accurate reflection of how people act or of what they believe
- Other forms of bias
- These might include the respondent not answering in a very truthful way
- Sampling bias
COST-EFFECTIVENESS OF MARKET RESEARCH
- Market research is not free – even gathering secondary data takes some time and buying market research reports or undertaking primary research can be very expensive
- However, the Internet and mobile (cell) phones have made it much easier to contact a very wide range of potential- even small and medium-sized businesses can use electronic means of contacting large numbers of customers in a short time period
- Online marketing allows firms to conduct research projects for just a few thousand dollars, taking advantage of pre-screened access panels with the results coming in within a few days- giving people the opportunity to respond conveniently by using their mobile (cell) phones increases the chance that they will respond to a survey request – especially if it is on a freephone number
- The mobile (cell) phone method of surveys can use pre-recorded messages and questions to which people respond by using numbers on the keypad or speaking the answers- these results are then automatically presented and analysed electronically
INTERPRETATION OF DATA
- Tables
- Pie graphs
- Line graphs
- Bar charts
- Histograms
ANALYSIS OF MARKET RESEARCH RESULTS
- Averages- an average is a typical or representative measure of a set of data; averages tell us about the ‘central tendency’ of data
- There are several different types of average that can be calculated from any set of data:
- Arithmetic mean- calculated by adding all the results and dividing by the number of results
- Mode- the value that occurs the most frequently in a set of data
- Median- the value of the middle item when data has been ordered or ranked; it divides the data into two equal parts
- There are several different types of average that can be calculated from any set of data:
- Measures of dispersion or spread of data
- Range- the difference between the highest and the lowest value
- Inter-quartile range- the range of the middle 50% of the data