
Costs
THE NEED FOR ACCURATE COST DATA
- Business costs are a key factor in the ‘profit equation’- profits or losses cannot be calculated without accurate cost data. If businesses do not keep a record of their costs, then they will be unable to take effective and profitable decisions, such as where to locate.
- Keeping cost records also allows comparisons to be made with past periods of time. In this way, the efficiency of a department or the profitability of a product may be measured and assessed over time.
- Past cost data can help to set budgets for the future. These will act as targets to work towards for the departments concerned. Actual cost levels can then be compared with budgets.
TYPES OF COSTS
- Direct costs
- These costs can be clearly identified with each unit of production and can be allocated to a cost centre
- The two most common direct costs in a manufacturing business are labour and materials
- The most important direct cost in a service business is the cost of the goods being sold
- Indirect costs
- These are costs that cannot be identified with a unit of production or allocated accurately to a cost centre (overheads)
- Indirect costs include utilities, office supplies, insurance costs, etc
- Fixed costs
- These are costs that do not vary with output in the short-term
- However, some fixed costs, such as rent, may change periodically but usually after a long period of time
- Variable costs
- These are costs that do vary with output, such as the materials used to make a product
- Semi-variable costs include both a fixed and a variable element, for example the electricity standing charge plus cost per unit used, and a salesperson’s fixed basic wage plus a commission that varies with sales
- These are costs that do vary with output, such as the materials used to make a product
- Marginal costs
- These are the extra costs of producing one more unit of output, and will be the extra variable costs needed to make this extra unit
PROBLEMS IN CLASSIFYING COSTS
- Are labour costs necessarily variable, direct costs?
- No, because when labour is unoccupied because of a lack of orders, most businesses will still continue to employ and pay workers in the short run.
- Wages then become an overhead cost, which cannot be directly allocated to any particular output.
- Similarly, a television presenter may be employed on a fixed-contract salary, which will not be related to the amount of work done. In addition, the salaries of administration, selling and other staff are always considered to be an indirect cost, probably fixed in the short run, because these costs cannot be identified with any one of the firm’s products or services.
- Not all direct costs are variable costs.
- For example, if a hotel buys a new juicing machine for the bar department, this is a direct cost to that department – but the cost of the machine will not vary with the number of orange juices being served.
BREAK-EVEN ANALYSIS
- The break-even output is the point where total revenues=total costs
- Break-even analysis can be undertaken in two ways: the graphical method and the equation method
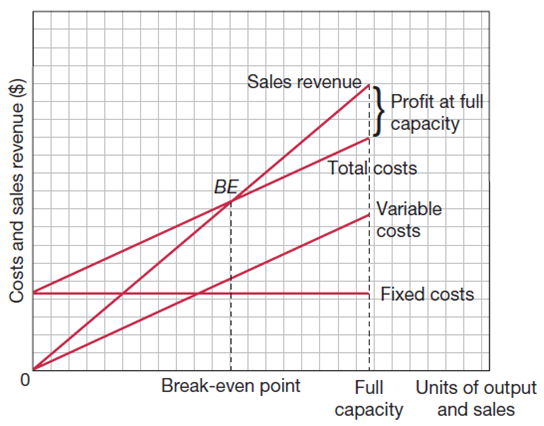
- The graphical method- break-even chart
- The chart is usually drawn showing three pieces of information:
- Fixed costs, which, in the short term, will not vary with the level of output and which must be paid whether the firm produces anything or not
- Total costs, which are the addition of fixed and variable costs; we will assume, initially at least, that variable costs vary in direct proportion to output
- Sales revenue obtained by multiplying selling price by output level
- On a typical break-even chart:
- The fixed-cost line is horizontal, showing that fixed costs are constant at all output levels.
- Sales revenue starts at the origin (0) because if no sales are made, there can be no revenue.
- The variable-cost line starts from the origin (0) because if no goods are produced, there will be no variable costs.
- The total-cost line begins at the level of fixed costs, the difference between total and fixed costs being accounted for by variable costs.
- The point at which the total-cost and sales-revenue lines cross (BE) is the break-even point. At production levels below the break-even point, the business is making a loss; at production levels above the break-even point, the business is making a profit
- The chart is usually drawn showing three pieces of information:
- The graphical method- break-even chart
- Margin of Safety
- The amount by which the sales level exceeds the break-even level of output- the difference between actual level of output and break-even level of output
- A profitable business is one that operates with a positive margin of safety
- If a firm is producing below the break-even point, it is in danger- this is sometimes expressed as a negative margin of safety.
The break-even equation
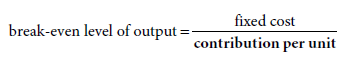
- Selling price – variable costs per unit = contribution per unit
- Further uses of break-even analysis
- The charts can be redrawn showing a potential new situation and this can then be compared with the existing position of the business. Care must be taken in making these comparisons, as forecasts and predictions are usually necessary.
- Examples:
- A marketing decision – the impact of a price increase
- An operations management decision – the purchase of new equipment with lower variable costs
- Choosing between two locations for a new factory.
- Usefulness of break-even analysis
- Charts are relatively easy to construct and interpret.
- Analysis provides useful guidelines to management on break-even points, safety margins and profit/loss levels at different rates of output.
- Comparisons can be made between different options by constructing new charts to show changed circumstances.
- The equation produces a precise break-even result.
- Break-even analysis can be used to assist managers when taking important decisions, such as location decisions, whether to buy new equipment and which project to invest in.
- Evaluation of break-even analysis
- Limitations:
- The assumption that costs and revenues are always represented by straight lines is unrealistic- not all variable costs change directly or ‘smoothly’ with output.
- Not all costs can be conveniently classified into fixed and variable costs- the introduction of semi-variable costs will make the technique much more complicated.
- There is no allowance made for inventory levels on the break-even chart. It is assumed that all units produced are sold. This is unlikely to always be the case in practice.
- It is also unlikely that fixed costs will remain unchanged at different output levels up to maximum capacity.
- Limitations: